Initial analysis on the Russo-Ukrainian War corpus on Twitter
Twitter consists one of the most popular social networks, attracting millions of users, including malicious entities. In this study, we delve into a recent dataset regarding the Russo-Ukrainian war in order to analyze malicious activity and suspension of users from Twitter. The scope of this work is to investigate online malicious activity on Twitter, as part of our goal in CONCORDIA- Task T1.5: User-Centric Security.
On 24 February 2022, Russia invaded Ukraine, also known now as Russo-Ukrainian War which gained the attention of the international public opinion and sparkle of public conversations on social media. Twitter is nowadays one of the most popular online social networks and one of the main sources of communication and dissemination in the online world. It has been used in the past to analyze crises in the political world. Considering this, we have initiated an ongoing dataset acquisition from Twitter API. The dataset has reached the amount of 57.3 million tweets, originating from 7.7 million users, until now[1].
We apply an initial volume and sentiment analysis, while the dataset can be used to further exploratory investigation towards topic and sentiment analysis in order to reveal the main trends and topics discussed in this online discourse, watch the tendencies of users, discover malicious entities and identify suspension of users. The analysis shown here is being updated on daily basis and can be found here: https://alexdrk14.github.io/RussiaUkraineWar/.
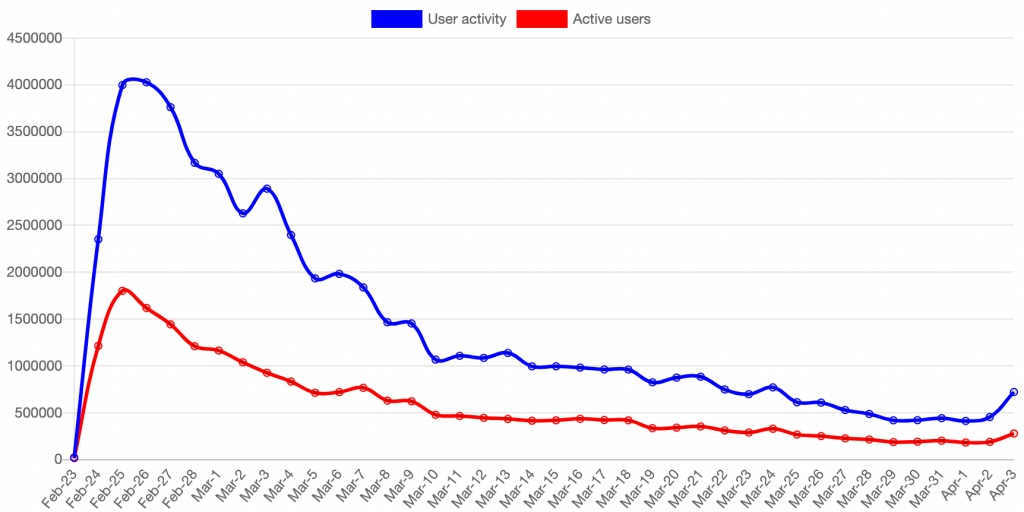
In figure 1 we present the volume of tweets per day, while in figure 2 we show the volume of the suspended or deactivated accounts per day. We notice increased activity in the first days of the attack, while the suspended accounts are increasing. Figure 3 shows the daily volume of traffic based on the text language of the tweet. We only presented the ten most popular languages in the collected dataset. We notice that the language used in the majority of tweets is English.
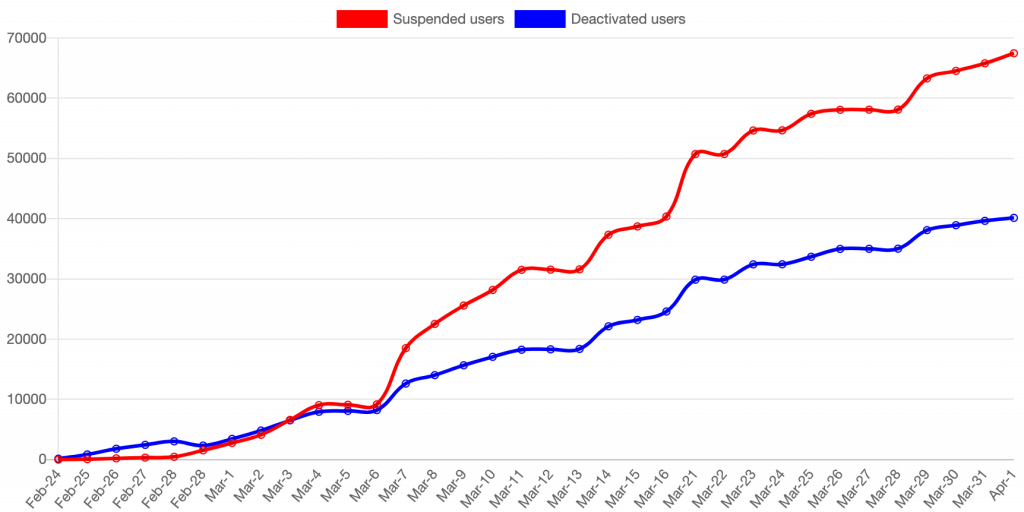
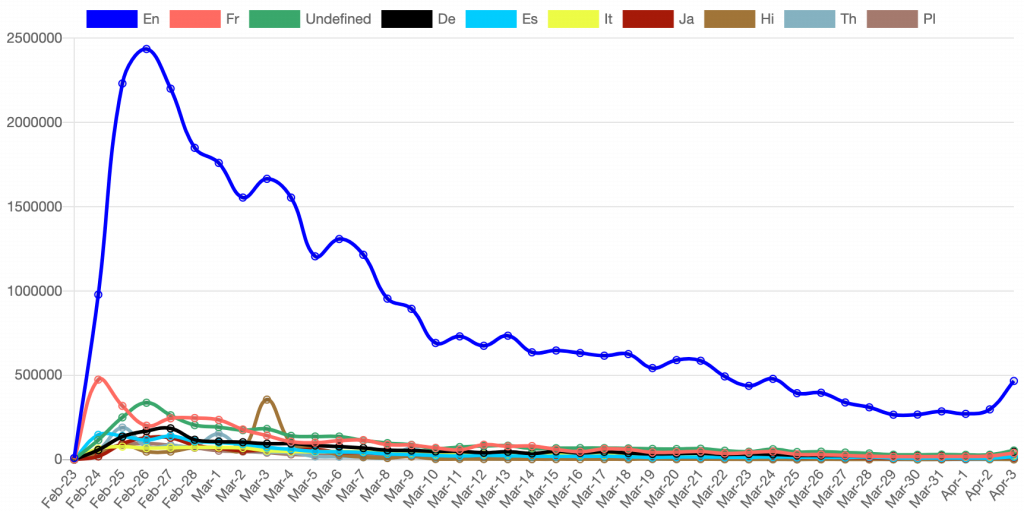
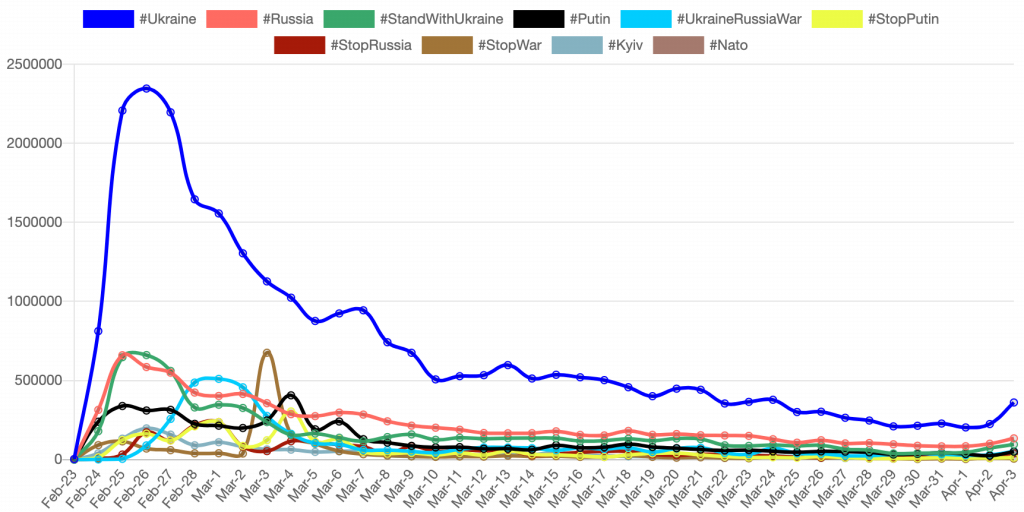
Figure 4 presents the daily volume of HTs traffic, while only the ten most popular hashtags in the collected dataset are included. As it seems, the most popular HT is \#Ukraine.
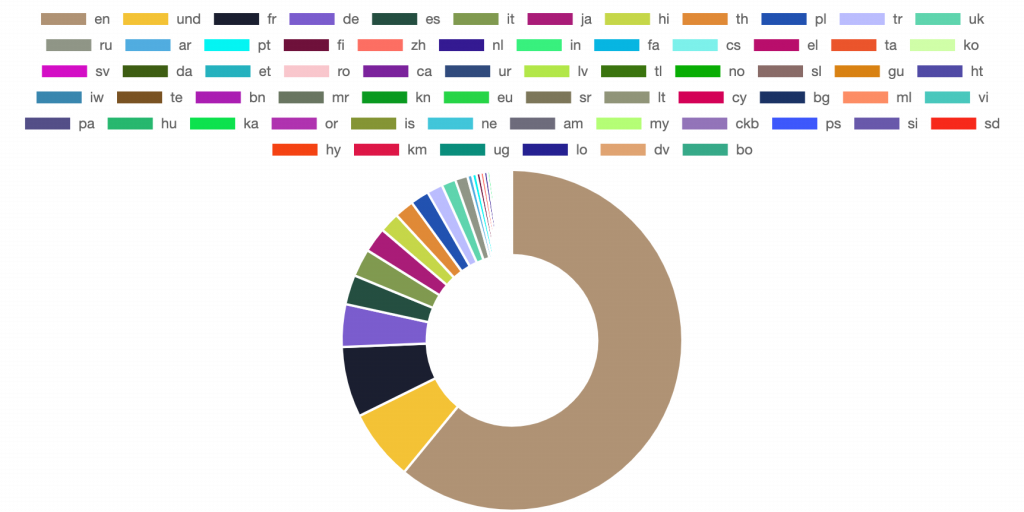
Finally, in figure 5 we show the total volume of tweets, based on text language, where we present all the languages in the collected dataset. As shown in figure 3 the most popular language in tweets is English.
Additionally, we apply sentiment analysis by using Vader cite{HuttoG14} . The results are shown in the figures below.
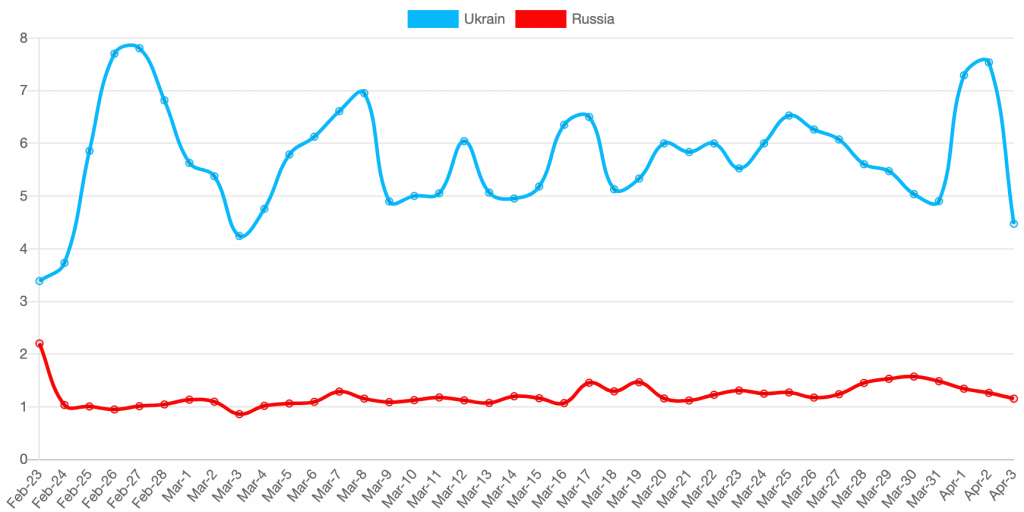
Specifically, in figure 6, we show the daily positive sentiment between Ukraine and Russia, with the higher values representing bigger support by Twitter users.
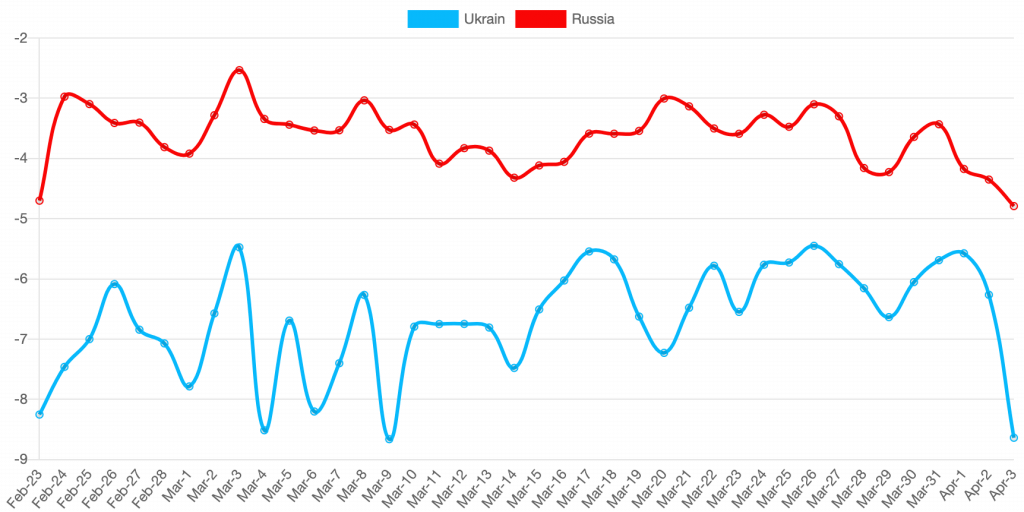
Figure 7 shows the negative sentiment between Ukraine and Russia per day, with lower values corresponding to higher disagreement (sadness, rage, etc.) by Twitter users.
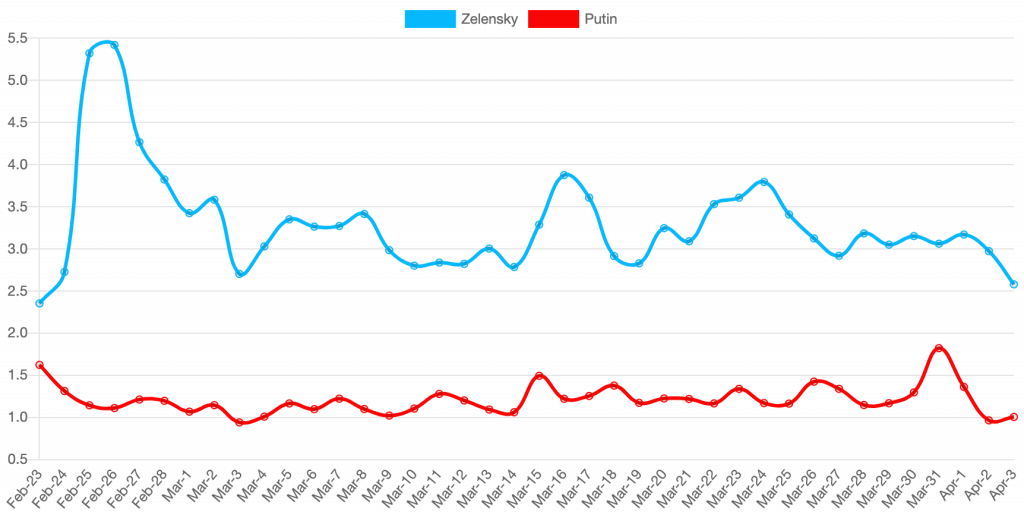
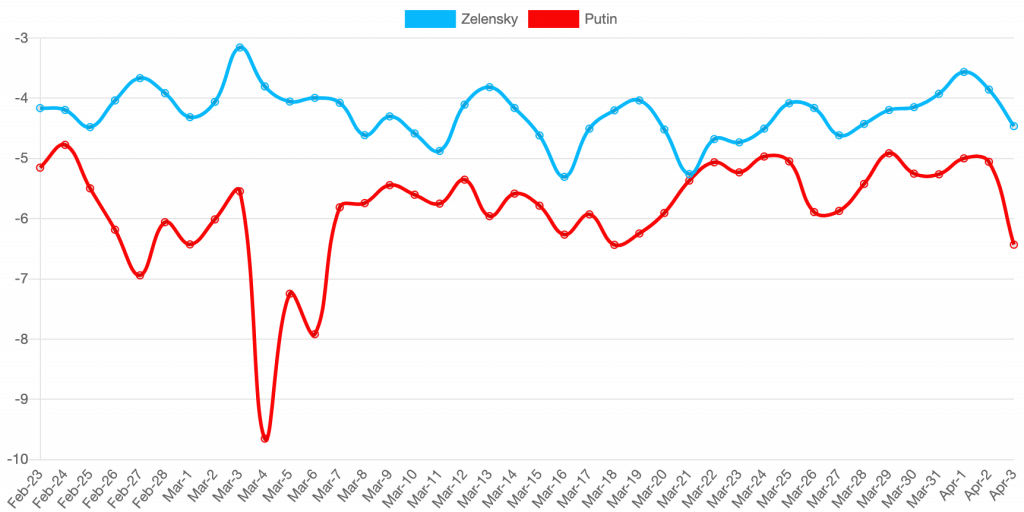
Finally, we plot the positive and negative sentiment between Ukraine and Russia presidents in figures 8, 9 respectively with higher values showing bigger support by Twitter users in positive sentiment while lower values show higher disagreement (sadness, rage, etc.) by Twitter users.
| Hashtag | # of tweets |
| #Ukraine | 28,578,739 |
| #Russia | 9,070,451 |
| #StandWithUkraine | 6,826,617 |
| #Putin | 4,851,536 |
| #UkraineRussiaWar | 4,007,785 |
| #StopRussia | 2,346,969 |
| #StopPutin | 2,332,136 |
| #StopWar | 1,877,518 |
| #Kyiv | 1,777,401 |
| #NATO | 1,686,092 |
In table 1 we show the total number of tweets contained in each hashtag, for the ten most popular hashtags retrieved in our dataset, while in table 2, we show the total number of for each language, only for the top ten most popular languages in our dataset.
| Language | # of tweets |
| English | 35,007,332 |
| Unclear/Mix | 3,883,865 |
| French | 3,821,685 |
| German | 2,333,747 |
| Spanish | 1,606,082 |
| Italian | 1,541,243 |
| Japanese | 1,353,848 |
| Hindi | 1,076,816 |
| Thai | 1,047,481 |
| Polish | 1,012,907 |
References:
- The dataset is available on Github, at https://github.com/alexdrk14/RussoUkrainianWar_Dataset, but due to privacy restrictions applied by Twitter API, we only provide the tweet IDs.
(By Despoina Antonakaki, Foundation for Research and Technology – Hellas (FORTH), Greece)